
FR PL
Case studies
Five operations, told the way they ran: the problem, what we built, and the numbers it moved.

A 40-year power infrastructure engineering firm, modernising how it plans, purchases and delivers, in support of a 3x growth target across Poland and Saudi Arabia.
The problem
Their systems worked, but they didn't talk to each other. Purchasing ran on email and paper with no approval trail, project data sat fragmented across separate tools, and getting a full picture meant piecing it together by hand.
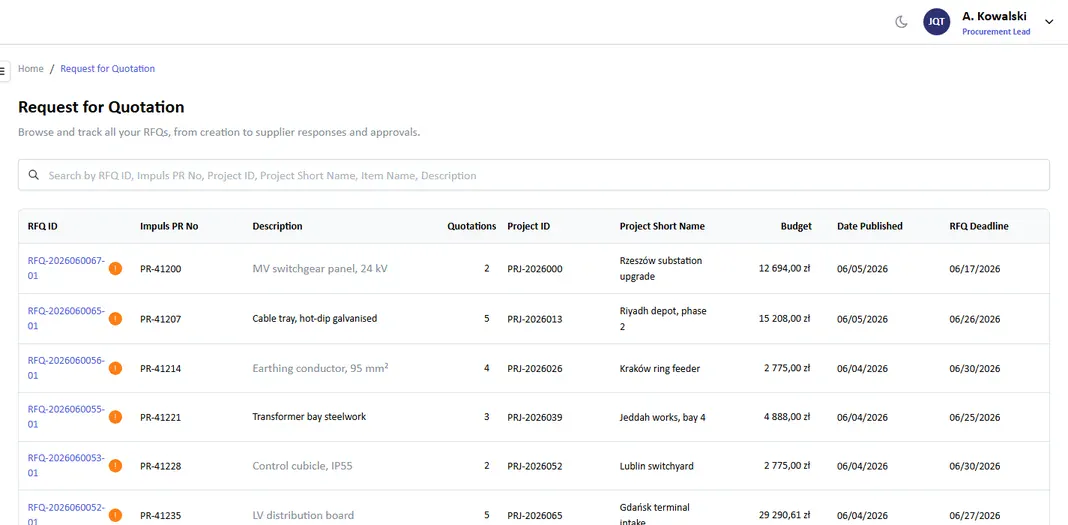
Every RFQ, its bids and its deadline on one screen. Sample data.
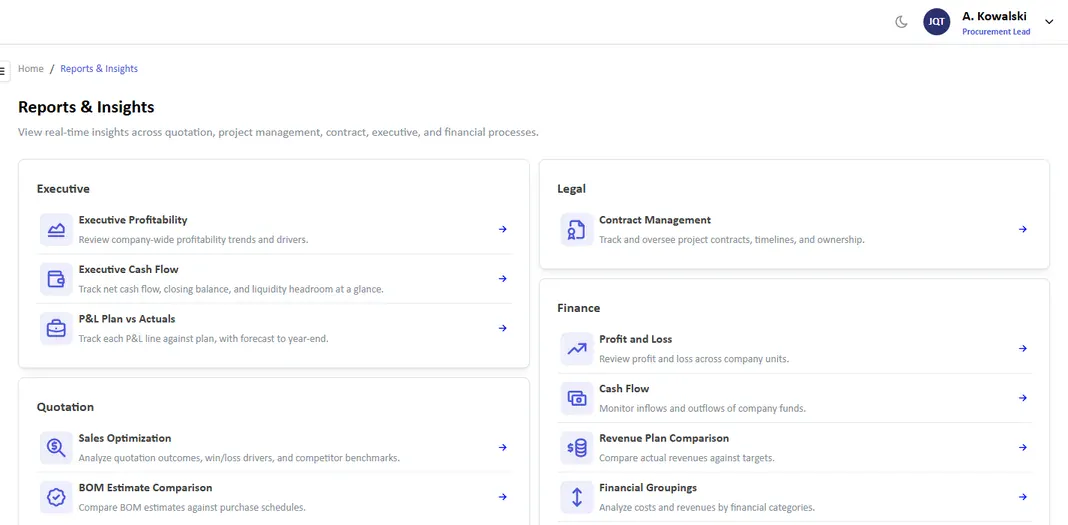
The dashboard catalogue: executive, legal, finance and quotation views. Sample data.
What we built
01
Requisition, quotation and order are one chain, not four inboxes.
02
No email thread to chase, every bid on the same sheet.
03
Executive, finance, project and contract views off one data layer.
What changed
Before Typed by hand into the ERP, HR and project tools and shared drives.
After Every system feeds one data warehouse: zero manual work, always current.
Before Budgets cross-checked against schedules by hand.
After Budgets and schedules sync automatically: hours of admin gone weekly.
Before Purchase requests encoded manually; RFQs sent to suppliers over email, untracked.
After Requests pulled from the digital bill of materials; RFQs auto-sent, bids submitted in the portal.
Before Print, sign, scan; delivery slips signed on paper, invisible to HQ.
After Approvals and deliveries logged digitally, tracked the moment they happen.
Before A static, compiled report: no way to see real-time project data.
After 13 live dashboards, refreshed automatically every day.
A Swiss precision-electronics manufacturer, catching production risks before they cause delays, without changing the planning routine it already has.
The problem
Each week, teams planned production by hand with no easy way to know in advance whether the plan was realistic. A missing part, a busy machine or a staffing gap only became visible once the week was already under way.
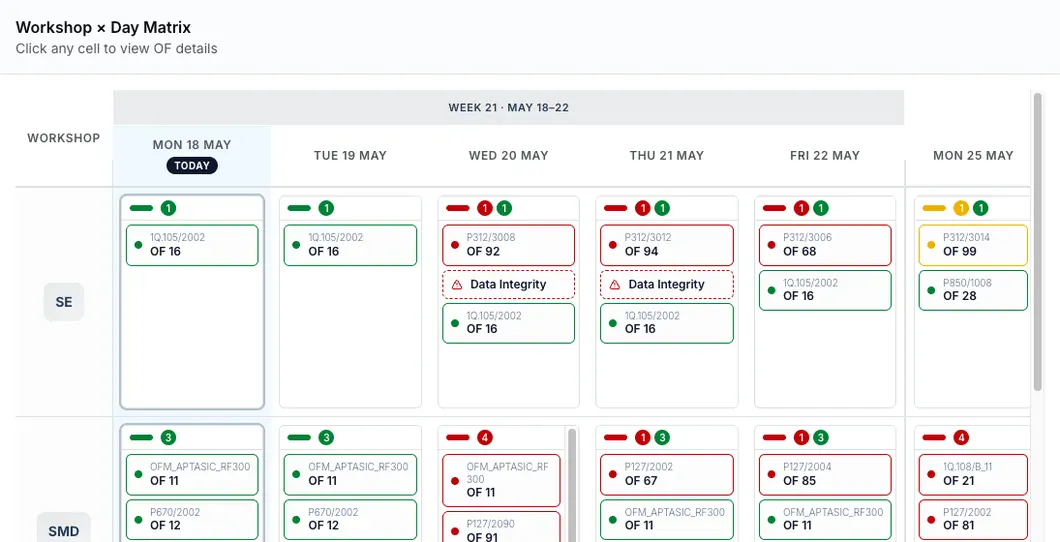
Every planned order red, amber or green, a week ahead. Order codes only.
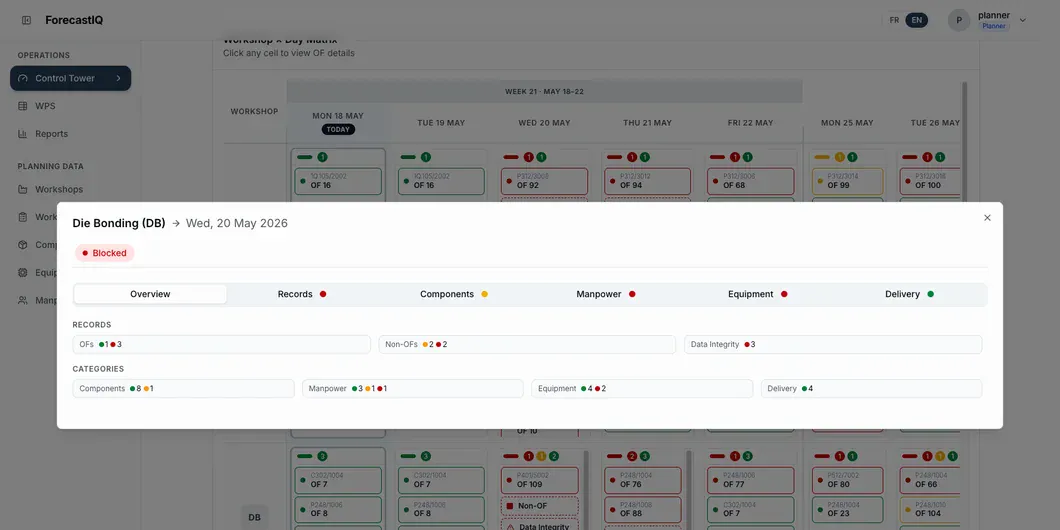
Why it is red, down to the part, the machine or the person.
What we built
01
Every workshop against every day, on the plan they already keep.
02
Three questions asked automatically for every planned order.
03
Read straight from their sheets and ERP. Nothing in it changed.
What changed
Before Team leaders fill planning sheets by hand, one file per workshop.
After The same plans, read automatically from the sheets and ERP each week.
Before No automated check against components, equipment or staffing.
After All three checked automatically: zero manual work, always current.
Before Risk surfaces only once the week is already under way.
After Green, amber or red: flagged before the week starts.
Before The team scrambles once a shortage is discovered.
After Problems fixed before they disrupt the floor.
A technology retail and distribution group with five business units, each knowing the customer its own way. One portal now stands in front, with one customer record behind it, on the CRM they already run.
The problem
ERP, point of sale, web store and two marketplaces each held a piece of the same customer. Nobody saw the whole relationship, so the next offer, the next renewal and the next follow-up were guesses.
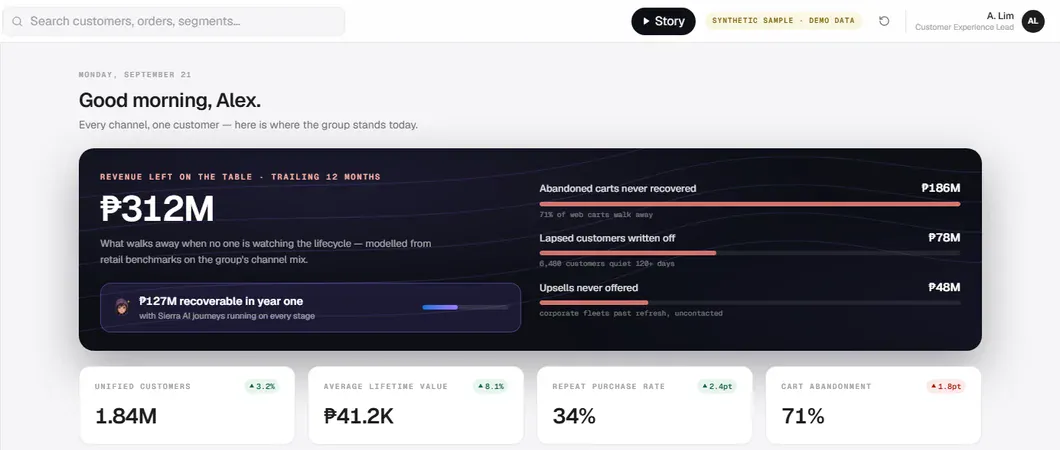
What the lifecycle is leaving on the table, and what is recoverable. Prototype on synthetic data.
What we built
01
ERP, POS, web store and two marketplaces resolved in real time. No migration.
02
Every recommendation shows the steps that produced it.
03
The portal and the lifecycle layer sit on top of it, not in place of it.
A Swiss maker of watch components running ERP, production planning, HR and documents on four separate stacks, with a hand-maintained BI on top. The brief, in their words: one platform they own, hosted locally, with no licence meter running.
The problem
Four stacks, four licences, none of them speaking to the others. And a BI nobody could keep up with: hand-maintained, constant effort, and still not the decision support they wanted.
A watch movement. Illustrative, not the client's own.
What we built
01
Two days on site, every system and every hand-off drawn.
02
Five working days to a prioritised plan the board could decide on.
03
ERP, production planning, HR and documents consolidated. Hosted locally, no licence meter.
A Swiss watchmaking-components maker with six decades of technical drawings across binders, scans and spreadsheets. Finding the right one took hours. Now it takes a search, with the price last quoted beside it.
The problem
The right drawing already existed. Finding it took hours across binders, scans and spreadsheets, and every quote started from scratch.
An engineering drawing. Illustrative, not the client's own.
What we built
01
216 folders and 7,338 files, counted and classified before anything was built.
02
Comparable jobs surface with a confidence score, so the quote starts from history.
03
Their drawings are the proof case the reader is trained and measured against: four weeks and 24 drawings first, then the full archive in eight.
The first step
We spend a week inside your operation and show you, in numbers, where AI would pay for itself. What happens next is your call.
Book a free AI assessment